Project single-cell states onto the global cell state manifold
In this tutorial, we will use SCMG as a “Global Positioning System” to project single-cells onto the global map of cell states.
Let’s begin by importing the required packages.
[1]:
import os

import numpy as np
import pandas as pd
import matplotlib.pyplot as plt
import seaborn as sns

import scanpy as sc

import torch

from scmg.model.contrastive_embedding import CellEmbedder, embed_adata
from scmg.model.cell_type_search import CellTypeSearcher
from scmg.preprocessing.data_standardization import GeneNameMapper, standardize_adata
Load the trained SCMG model.
[2]:
# Load the autoencoder model
model_path = 'models/embedder'

scmg_model = torch.load(os.path.join(model_path, 'model.pt'),
                        map_location=torch.device('cpu'))
scmg_model.load_state_dict(torch.load(os.path.join(model_path, 'best_state_dict.pth'),
                    map_location=torch.device('cpu')))

device = 'cpu'
scmg_model.to(device)
scmg_model.eval()
[2]:
CellEmbedder(
  (encoder): MLP(
    (layers): ModuleList(
      (0): Linear(in_features=18108, out_features=2048, bias=True)
      (1): LayerNorm((2048,), eps=1e-05, elementwise_affine=True)
      (2): LeakyReLU(negative_slope=0.01)
      (3): Dropout(p=0.0, inplace=False)
      (4): Linear(in_features=2048, out_features=2048, bias=True)
      (5): LayerNorm((2048,), eps=1e-05, elementwise_affine=True)
      (6): LeakyReLU(negative_slope=0.01)
      (7): Dropout(p=0.0, inplace=False)
      (8): Linear(in_features=2048, out_features=512, bias=True)
    )
  )
  (decoder): MLP(
    (layers): ModuleList(
      (0): Linear(in_features=576, out_features=1024, bias=True)
      (1): LayerNorm((1024,), eps=1e-05, elementwise_affine=True)
      (2): LeakyReLU(negative_slope=0.01)
      (3): Dropout(p=0, inplace=False)
      (4): Linear(in_features=1024, out_features=2048, bias=True)
      (5): LayerNorm((2048,), eps=1e-05, elementwise_affine=True)
      (6): LeakyReLU(negative_slope=0.01)
      (7): Dropout(p=0, inplace=False)
      (8): Linear(in_features=2048, out_features=18108, bias=True)
    )
  )
)
Load the example datasets
[3]:
adata_ref = sc.read_h5ad('data/ref_global_cell_state_manifold.h5ad')
adata = sc.read('data/tutorial_data/Travaglini_Lung_HS_2021_10x_subsample.h5ad')
adata.var.index = adata.var['feature_id']
Project a dataset of natural cell states
First, let’s project a dataset that excluded from SCMG training to the representation dataset of the global cell state manifold.
[4]:
# Embed the query dataset
embed_adata(scmg_model, adata, batch_size=8192)

# Project the query dataset to the reference dataset
cts = CellTypeSearcher(adata_ref)
cell_match_df = cts.search_ref_cell(adata.obsm['X_ce_latent'])
adata.obsm['X_project_umap'] = cell_match_df[['umap_x', 'umap_y']].values
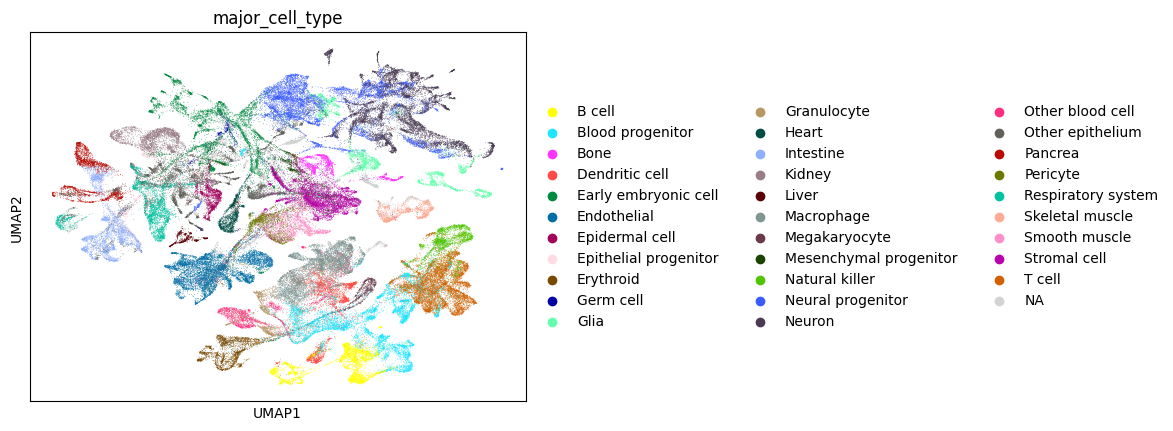
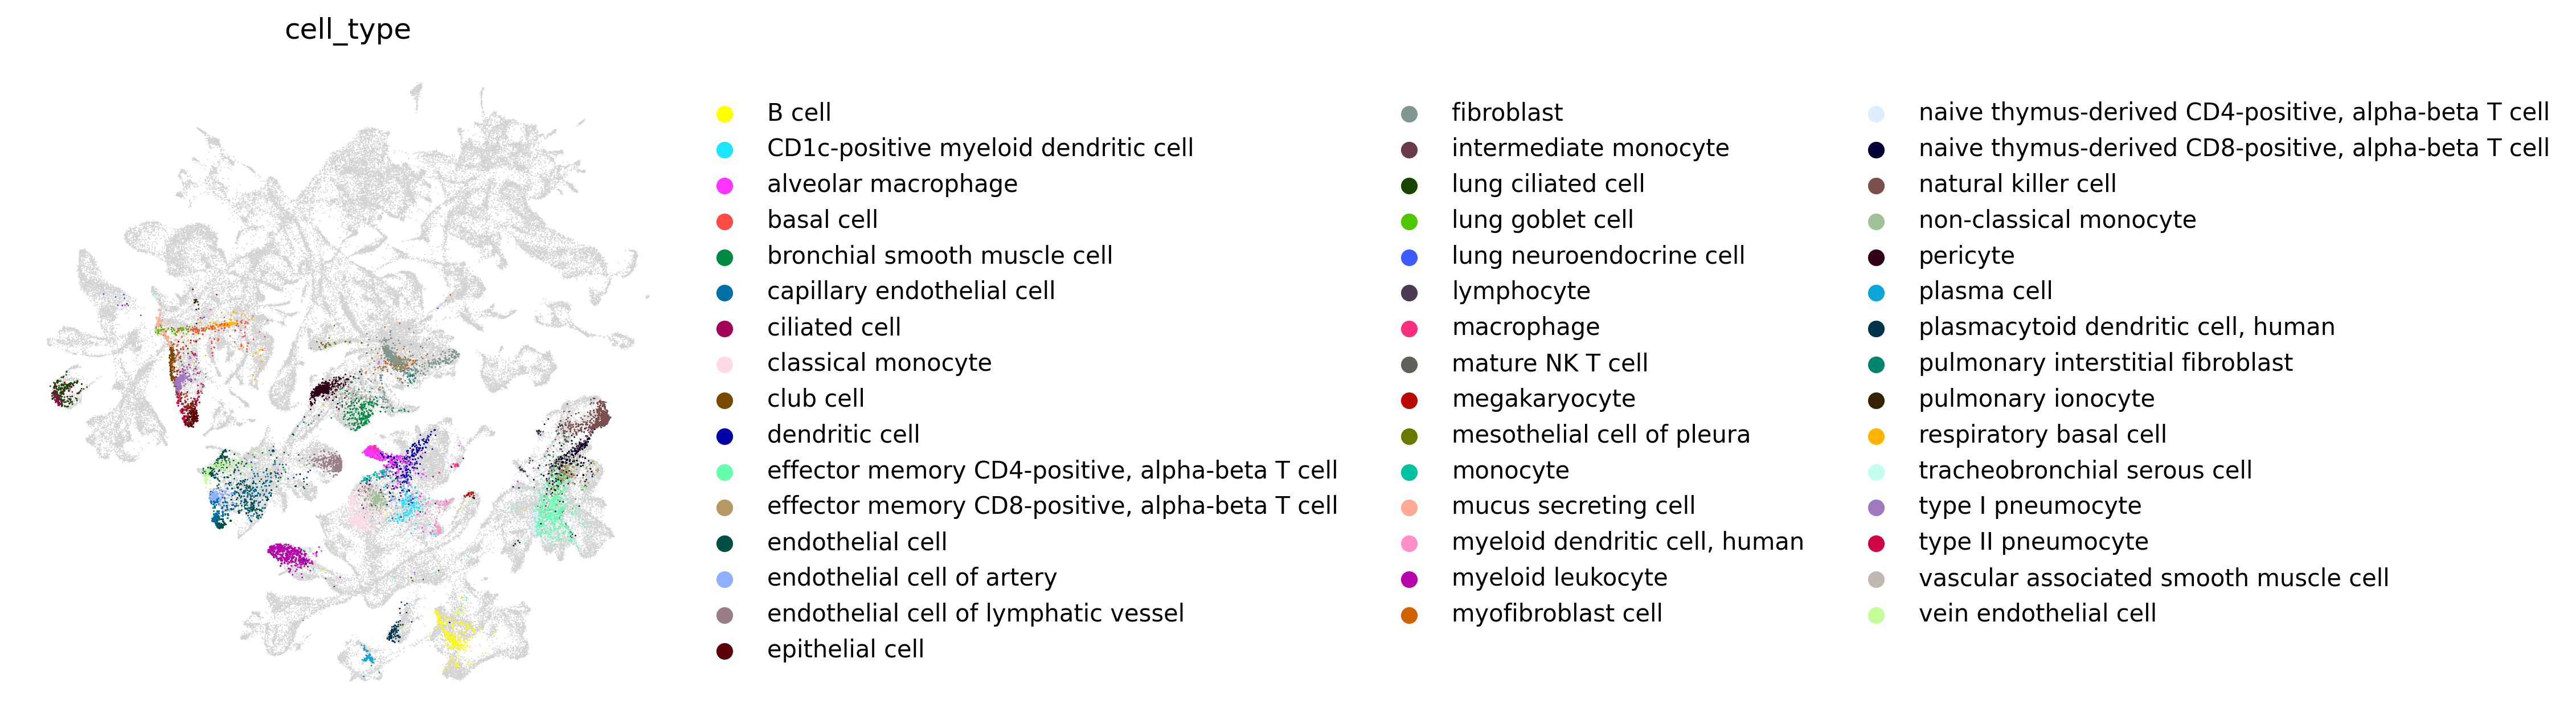
We can visualize the projected cells on the global cell state UMAP.
[5]:
sc.pl.umap(adata_ref, color='major_cell_type')

fig, ax = plt.subplots(1, 1, figsize=(5, 5), dpi=300)
sc.pl.umap(adata_ref, ax=ax, show=False)
sc.pl.embedding(adata, basis='X_project_umap', color='cell_type', ax=ax, frameon=False)
plt.show()
We can quantitatively compare the correspondence between the query cell types and the projected reference cell types.
[6]:
adata.obs['ref_cell'] = cell_match_df['ref_cell'].values
adata.obs['projected_cell_type'] = adata_ref.obs['cell_type'].loc[
                                            cell_match_df['ref_cell']].values

ct_confusion_df = pd.crosstab(adata.obs['cell_type'], adata.obs['projected_cell_type'])
ct_confusion_df = ct_confusion_df / ct_confusion_df.values.sum(axis=1)[:, None]

for ct_query in ct_confusion_df.index:
    print(ct_confusion_df.loc[ct_query].sort_values(ascending=False).head(5))
    print()
projected_cell_type
B cell             0.613793
naive B cell       0.166897
plasma cell        0.064828
memory B cell      0.051034
immature B cell    0.027586
Name: B cell, dtype: float64

projected_cell_type
conventional dendritic cell             0.379699
dendritic cell                          0.274436
CD1c-positive myeloid dendritic cell    0.086466
Langerhans cell                         0.071429
macrophage                              0.048872
Name: CD1c-positive myeloid dendritic cell, dtype: float64

projected_cell_type
alveolar macrophage                   0.681553
alternatively activated macrophage    0.226958
elicited macrophage                   0.051649
macrophage                            0.023415
dendritic cell                        0.005837
Name: alveolar macrophage, dtype: float64

projected_cell_type
club cell                  0.201923
respiratory basal cell     0.147436
respiratory goblet cell    0.144231
lung secretory cell        0.083333
basal cell                 0.054487
Name: basal cell, dtype: float64

projected_cell_type
tracheobronchial smooth muscle cell       0.297258
pericyte                                  0.227994
bronchial smooth muscle cell              0.168831
vascular associated smooth muscle cell    0.126984
Vascular smooth muscle                    0.057720
Name: bronchial smooth muscle cell, dtype: float64

projected_cell_type
capillary endothelial cell           0.872412
pulmonary artery endothelial cell    0.075497
endothelial cell                     0.017860
endothelial cell of artery           0.017183
vein endothelial cell                0.004735
Name: capillary endothelial cell, dtype: float64

projected_cell_type
lung ciliated cell                                 0.420455
ciliated columnar cell of tracheobronchial tree    0.375000
multi-ciliated epithelial cell                     0.193182
basal epithelial cell of tracheobronchial tree     0.011364
Adipocyte progenitor cells                         0.000000
Name: ciliated cell, dtype: float64

projected_cell_type
monocyte                                 0.527203
classical monocyte                       0.182475
CD14-positive monocyte                   0.125662
CD14-positive, CD16-positive monocyte    0.041887
non-classical monocyte                   0.037073
Name: classical monocyte, dtype: float64

projected_cell_type
epithelial cell of alveolus of lung           0.404941
epithelial cell of lower respiratory tract    0.252417
club cell                                     0.211600
type II pneumocyte                            0.053706
epithelial cell of lung                       0.032223
Name: club cell, dtype: float64

projected_cell_type
macrophage             0.375215
elicited macrophage    0.099828
dendritic cell         0.079174
lung macrophage        0.077453
Hofbauer cell          0.048193
Name: dendritic cell, dtype: float64

projected_cell_type
T cell                                       0.499834
CD4-positive, alpha-beta T cell              0.135413
regulatory T cell                            0.103551
CD8-positive, alpha-beta T cell              0.032526
activated CD4-positive, alpha-beta T cell    0.026220
Name: effector memory CD4-positive, alpha-beta T cell, dtype: float64

projected_cell_type
T cell                                       0.325210
CD8-positive, alpha-beta cytotoxic T cell    0.118487
CD8-positive, alpha-beta T cell              0.111765
mature NK T cell                             0.106723
natural killer cell                          0.064706
Name: effector memory CD8-positive, alpha-beta T cell, dtype: float64

projected_cell_type
capillary endothelial cell           0.894359
endothelial cell                     0.035703
vein endothelial cell                0.029834
pulmonary artery endothelial cell    0.010923
gut endothelial cell                 0.004728
Name: endothelial cell, dtype: float64

projected_cell_type
pulmonary artery endothelial cell    0.674528
endothelial cell of artery           0.207547
capillary endothelial cell           0.048518
endothelial cell                     0.037736
endothelial cell of vascular tree    0.008086
Name: endothelial cell of artery, dtype: float64

projected_cell_type
endothelial cell of lymphatic vessel                      0.892934
endothelial cell                                          0.057816
dermis microvascular lymphatic vessel endothelial cell    0.012848
gut endothelial cell                                      0.008565
endothelial cell of placenta                              0.006424
Name: endothelial cell of lymphatic vessel, dtype: float64

projected_cell_type
type II pneumocyte                     0.977578
club cell                              0.007474
epithelial cell of lung                0.004484
type I pneumocyte                      0.004484
epithelial cell of alveolus of lung    0.002990
Name: epithelial cell, dtype: float64

projected_cell_type
alveolar type 1 fibroblast cell      0.405433
fibroblast of lung                   0.108150
pulmonary interstitial fibroblast    0.079959
bronchus fibroblast of lung          0.077909
alveolar type 2 fibroblast cell      0.060482
Name: fibroblast, dtype: float64

projected_cell_type
non-classical monocyte                   0.489362
monocyte                                 0.202128
classical monocyte                       0.090426
CD14-positive monocyte                   0.085106
CD14-positive, CD16-positive monocyte    0.058511
Name: intermediate monocyte, dtype: float64

projected_cell_type
ciliated columnar cell of tracheobronchial tree    0.447388
lung ciliated cell                                 0.412566
multi-ciliated epithelial cell                     0.112036
ciliated cell                                      0.012112
ciliated epithelial cell                           0.006813
Name: lung ciliated cell, dtype: float64

projected_cell_type
nasal mucosa goblet cell                          0.276730
lung secretory cell                               0.176101
respiratory goblet cell                           0.157233
basal epithelial cell of tracheobronchial tree    0.125786
club cell                                         0.113208
Name: lung goblet cell, dtype: float64

projected_cell_type
enteroendocrine cell           0.454545
neuroendocrine cell            0.181818
pancreatic D cell              0.181818
melanocyte                     0.090909
type D enteroendocrine cell    0.090909
Name: lung neuroendocrine cell, dtype: float64

projected_cell_type
CD16-positive, CD56-dim natural killer cell, human    0.257143
natural killer cell                                   0.209524
T cell                                                0.152381
mature NK T cell                                      0.095238
immature NK T cell                                    0.085714
Name: lymphocyte, dtype: float64

projected_cell_type
alveolar macrophage                   0.588496
alternatively activated macrophage    0.318584
Adipose tissue macrophages            0.030973
macrophage                            0.022124
elicited macrophage                   0.013274
Name: macrophage, dtype: float64

projected_cell_type
T cell                             0.155224
CD8-positive, alpha-beta T cell    0.143284
natural killer cell                0.116418
CD4-positive, alpha-beta T cell    0.104478
mature NK T cell                   0.098507
Name: mature NK T cell, dtype: float64

projected_cell_type
megakaryocyte             0.45
platelet                  0.20
non-classical monocyte    0.10
monocyte                  0.10
bronchial goblet cell     0.05
Name: megakaryocyte, dtype: float64

projected_cell_type
mesothelial cell        0.931034
embryonic fibroblast    0.034483
epicardial adipocyte    0.034483
lung macrophage         0.000000
lung ciliated cell      0.000000
Name: mesothelial cell of pleura, dtype: float64

projected_cell_type
classical monocyte        0.333333
macrophage                0.236715
monocyte                  0.193237
elicited macrophage       0.125604
CD14-positive monocyte    0.048309
Name: monocyte, dtype: float64

projected_cell_type
epithelial cell of lower respiratory tract    0.780041
respiratory goblet cell                       0.081466
acinar cell                                   0.038697
tracheobronchial goblet cell                  0.034623
club cell                                     0.022403
Name: mucus secreting cell, dtype: float64

projected_cell_type
conventional dendritic cell             0.351145
dendritic cell                          0.343511
dendritic cell, human                   0.106870
Langerhans cell                         0.091603
CD1c-positive myeloid dendritic cell    0.038168
Name: myeloid dendritic cell, human, dtype: float64

projected_cell_type
mast cell                        0.741325
granulocyte                      0.220820
basophil                         0.029968
Mast cells                       0.003155
basophil mast progenitor cell    0.002629
Name: myeloid leukocyte, dtype: float64

projected_cell_type
myofibroblast cell                   0.463710
pulmonary interstitial fibroblast    0.165323
bronchus fibroblast of lung          0.129032
mesenchymal cell                     0.040323
pericyte                             0.032258
Name: myofibroblast cell, dtype: float64

projected_cell_type
T cell                                       0.457082
activated CD4-positive, alpha-beta T cell    0.157725
CD4-positive, alpha-beta T cell              0.118026
regulatory T cell                            0.086910
CD8-positive, alpha-beta T cell              0.050429
Name: naive thymus-derived CD4-positive, alpha-beta T cell, dtype: float64

projected_cell_type
T cell                                       0.292360
CD8-positive, alpha-beta cytotoxic T cell    0.159158
CD8-positive, alpha-beta T cell              0.139569
natural killer cell                          0.109207
activated CD8-positive, alpha-beta T cell    0.060725
Name: naive thymus-derived CD8-positive, alpha-beta T cell, dtype: float64

projected_cell_type
natural killer cell                                      0.508283
CD16-positive, CD56-dim natural killer cell, human       0.398406
mature NK T cell                                         0.059971
CD16-negative, CD56-bright natural killer cell, human    0.012791
T cell                                                   0.009646
Name: natural killer cell, dtype: float64

projected_cell_type
non-classical monocyte                   0.697761
monocyte                                 0.175373
macrophage                               0.062189
CD14-positive, CD16-positive monocyte    0.031095
classical monocyte                       0.012438
Name: non-classical monocyte, dtype: float64

projected_cell_type
pericyte                                  0.592040
lung pericyte                             0.331468
Pericyte                                  0.026741
smooth muscle cell                        0.016169
vascular associated smooth muscle cell    0.015547
Name: pericyte, dtype: float64

projected_cell_type
plasma cell        0.887701
IgA plasma cell    0.074866
IgG plasma cell    0.026738
plasmablast        0.005348
B cell             0.005348
Name: plasma cell, dtype: float64

projected_cell_type
plasmacytoid dendritic cell             0.810219
plasma cell                             0.153285
myeloid dendritic cell                  0.007299
common dendritic progenitor             0.007299
professional antigen presenting cell    0.007299
Name: plasmacytoid dendritic cell, human, dtype: float64

projected_cell_type
fibroblast                                 0.771429
mesenchymal stem cell of adipose tissue    0.114286
mesenchymal cell                           0.085714
mesothelial cell                           0.028571
eosinophil                                 0.000000
Name: pulmonary interstitial fibroblast, dtype: float64

projected_cell_type
ionocyte                   0.863636
lung secretory cell        0.090909
epithelial cell of lung    0.045455
lung pericyte              0.000000
keratinocyte               0.000000
Name: pulmonary ionocyte, dtype: float64

projected_cell_type
respiratory basal cell                        0.445194
epithelial cell of lung                       0.146712
basal cell                                    0.146712
epithelial cell of lower respiratory tract    0.055649
lung secretory cell                           0.052277
Name: respiratory basal cell, dtype: float64

projected_cell_type
tracheobronchial serous cell             0.666667
serous secreting cell                    0.125000
serous cell of epithelium of bronchus    0.083333
acinar cell                              0.083333
serous cell of epithelium of trachea     0.041667
Name: tracheobronchial serous cell, dtype: float64

projected_cell_type
type I pneumocyte                      0.913580
type II pneumocyte                     0.046296
respiratory epithelial cell            0.009259
epithelial cell of alveolus of lung    0.008230
epithelial cell of lung                0.006173
Name: type I pneumocyte, dtype: float64

projected_cell_type
type II pneumocyte                            0.929208
type I pneumocyte                             0.039853
epithelial cell of alveolus of lung           0.018091
club cell                                     0.003933
epithelial cell of lower respiratory tract    0.003408
Name: type II pneumocyte, dtype: float64

projected_cell_type
vascular associated smooth muscle cell    0.307036
pericyte                                  0.260128
tracheobronchial smooth muscle cell       0.206823
bronchial smooth muscle cell              0.070362
smooth muscle cell                        0.061834
Name: vascular associated smooth muscle cell, dtype: float64

projected_cell_type
vein endothelial cell                0.779221
capillary endothelial cell           0.071861
endothelial cell                     0.044156
pulmonary artery endothelial cell    0.035498
gut endothelial cell                 0.025108
Name: vein endothelial cell, dtype: float64
Let’s plot the correspondence between the query cell types and the top matched reference cell types as a confusion matrix.
[7]:
fig, ax = plt.subplots(1, 1, figsize=(18, 12))


sns.heatmap(ct_confusion_df.loc[
    [
    'plasma cell',
    'B cell',
    'natural killer cell',
    'lymphocyte',
    'mature NK T cell',
    'effector memory CD4-positive, alpha-beta T cell',
    'effector memory CD8-positive, alpha-beta T cell',
    'naive thymus-derived CD4-positive, alpha-beta T cell',
    'naive thymus-derived CD8-positive, alpha-beta T cell',
    'plasmacytoid dendritic cell, human',
    'CD1c-positive myeloid dendritic cell',
    'myeloid dendritic cell, human',
    'myeloid leukocyte',
    'monocyte',
    'classical monocyte',
    'intermediate monocyte',
    'non-classical monocyte',
    'dendritic cell',
    'macrophage',
    'alveolar macrophage',
    'megakaryocyte',
    'endothelial cell of artery',
    'endothelial cell',
    'capillary endothelial cell',
    'vein endothelial cell',
    'endothelial cell of lymphatic vessel',
    'pericyte',
    'vascular associated smooth muscle cell',
    'bronchial smooth muscle cell',
    'myofibroblast cell',
    'pulmonary interstitial fibroblast',
    'fibroblast',
    'mesothelial cell of pleura',
    'mucus secreting cell',
    'club cell',
    'basal cell',
    'respiratory basal cell',
    'ciliated cell',
    'lung ciliated cell',
    'lung goblet cell',
    'tracheobronchial serous cell',
    'pulmonary ionocyte',
    'type I pneumocyte',
    'type II pneumocyte',
    'epithelial cell',
    'lung neuroendocrine cell',
    ],
    [
    'plasma cell',
    'B cell',
    'CD16-positive, CD56-dim natural killer cell, human',
    'natural killer cell',
    'T cell',
    'plasmacytoid dendritic cell',
    'conventional dendritic cell',
    'mast cell',
    'classical monocyte',
    'monocyte',
    'non-classical monocyte',
    'macrophage',
    'alveolar macrophage',
    'megakaryocyte',
    'pulmonary artery endothelial cell',
    'capillary endothelial cell',
    'vein endothelial cell',
    'endothelial cell of lymphatic vessel',
    'pericyte',
    'tracheobronchial smooth muscle cell',
    'vascular associated smooth muscle cell',
    'myofibroblast cell',
    'fibroblast',
    'alveolar type 1 fibroblast cell',
    'mesothelial cell',
    'epithelial cell of lower respiratory tract',
    'epithelial cell of alveolus of lung',
    'respiratory basal cell',
    'lung ciliated cell',
    'ciliated columnar cell of tracheobronchial tree',
    'nasal mucosa goblet cell',
    'tracheobronchial serous cell',
    'ionocyte',
    'type I pneumocyte',
    'type II pneumocyte',
    'enteroendocrine cell',
    ]].T,
    cmap='viridis', vmax=0.7)
[7]:
<Axes: xlabel='cell_type', ylabel='projected_cell_type'>
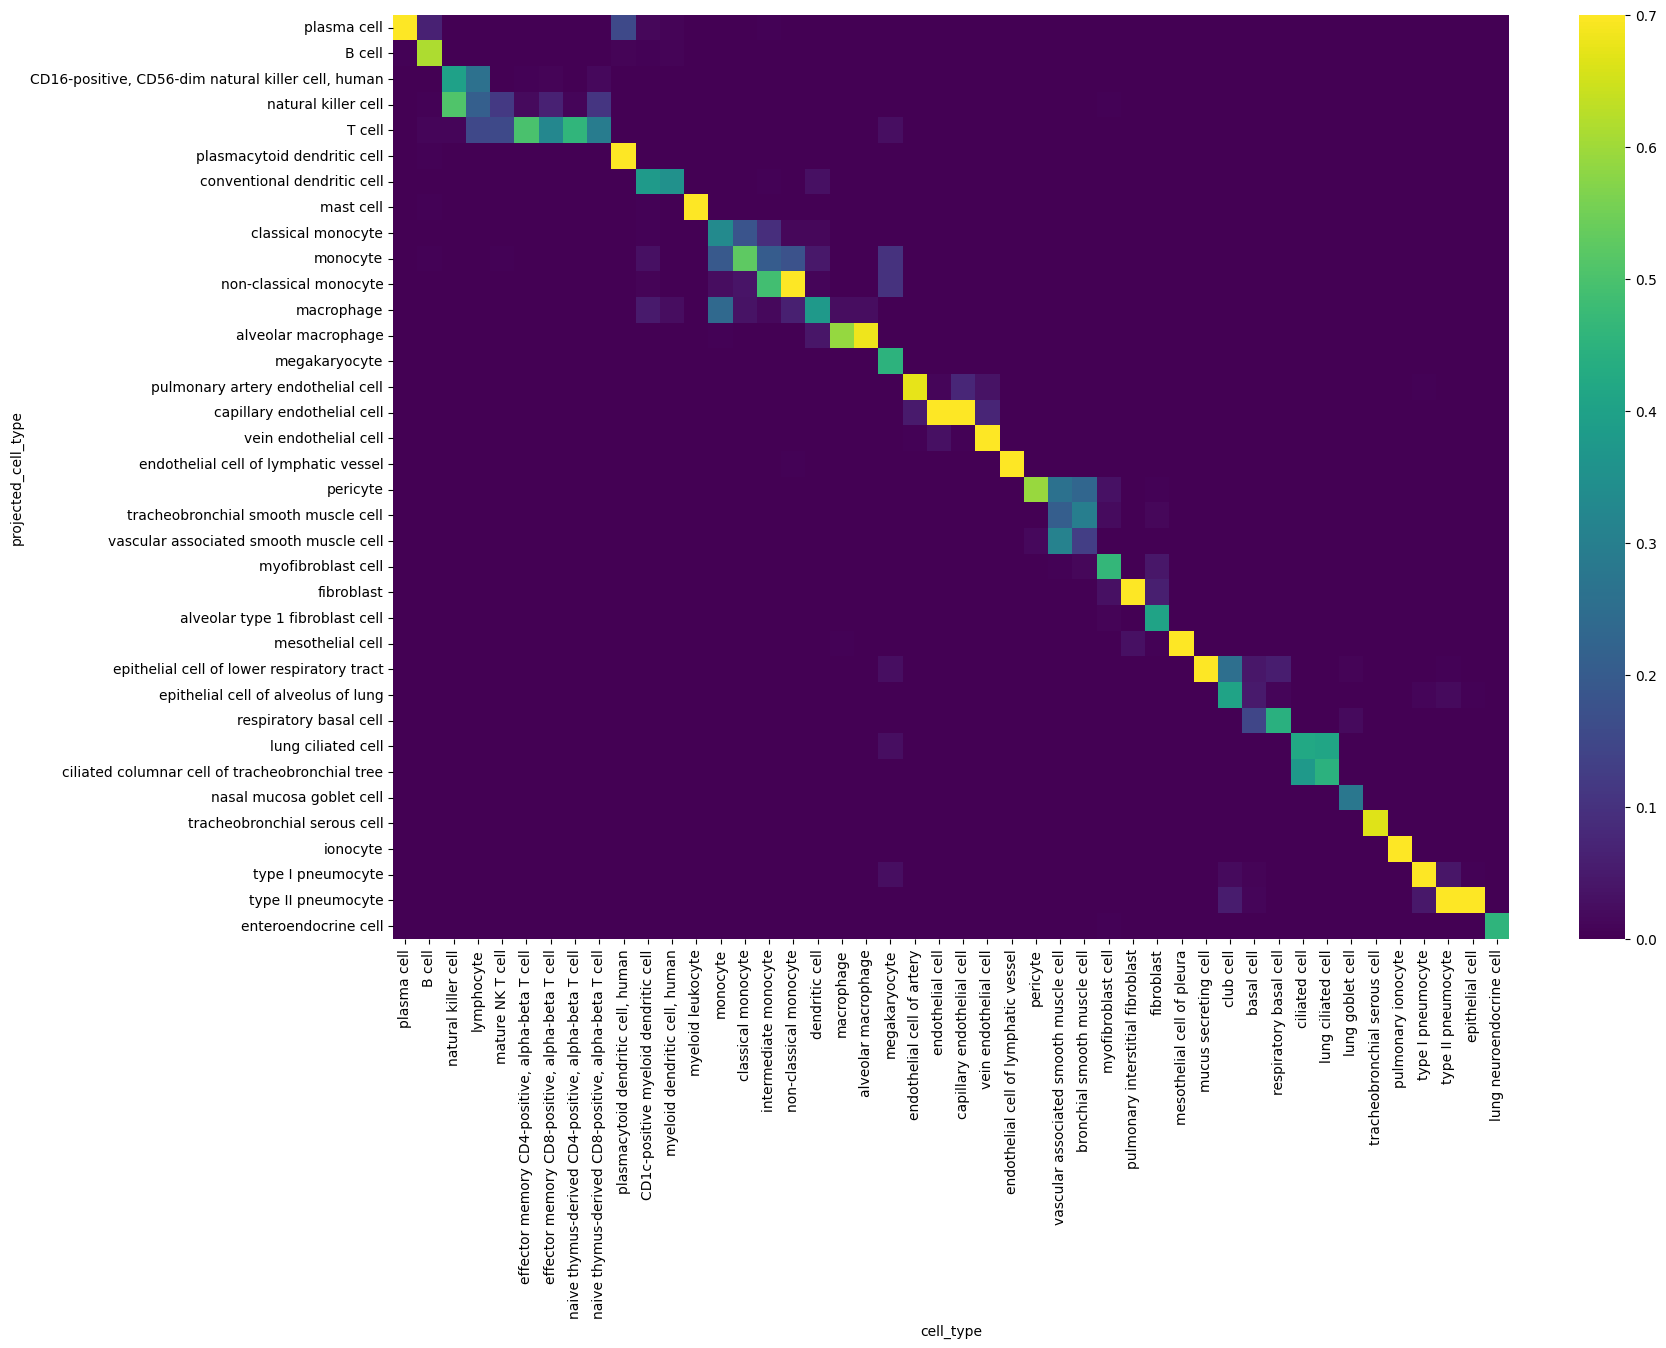
The confusion matrix shows that the query cells are correctly projected to the corresponding cell types in the global cell state manifold.
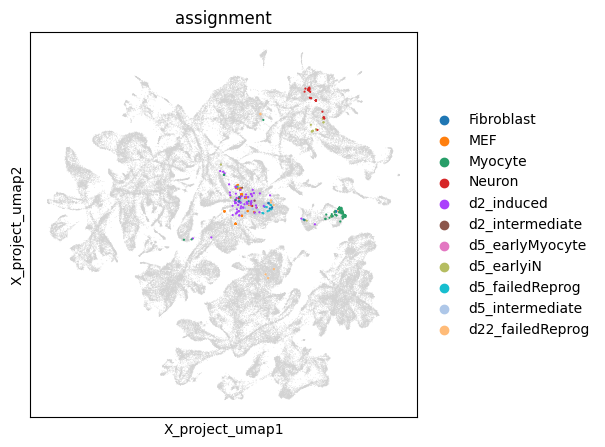
Project a dataset of transdifferentiation
Projecting single-cells onto the global cell state manifold can be useful for interpreting non-natural cell states generated in the lab.
As an example, let’s project cells from a transdifferentiation experiment.
[8]:
# Load the data
adata = sc.read_h5ad(
    'data/tutorial_data/Treutlein_2016_neuron_transdifferentiation.h5ad')

adata.obs_names_make_unique()
gene_name_mapper = GeneNameMapper()
adata.var.index = gene_name_mapper.map_gene_names(adata.var.index,
                            'mouse', 'human', 'name', 'id')
adata = adata[:, adata.var.index != 'na'].copy()
adata.var_names_make_unique()

# Embed the query dataset
embed_adata(scmg_model, adata, batch_size=4096)

# Project the query dataset to the reference dataset
cts = CellTypeSearcher(adata_ref)
cell_match_df = cts.search_ref_cell(adata.obsm['X_ce_latent'])
adata.obsm['X_project_umap'] = cell_match_df[['umap_x', 'umap_y']].values

# Visualize the UMAP projection
fig, ax = plt.subplots(1, 1, figsize=(5, 5), dpi=100)
sc.pl.umap(adata_ref, ax=ax, show=False)
sc.pl.embedding(adata,
                basis='X_project_umap', color='assignment',
                ax=ax, s=10)
plt.show()

# Plot the confusion matrix
adata.obs['projected_cell_type'] = adata_ref.obs['cell_type'].loc[
                                            cell_match_df['ref_cell']].values
ct_confusion_df = pd.crosstab(adata.obs['assignment'], adata.obs['projected_cell_type'])
ct_confusion_df = ct_confusion_df / ct_confusion_df.values.sum(axis=1)[:, None]

fig, ax = plt.subplots(1, 1, figsize=(5.5, 4), dpi=100)

sns.heatmap(ct_confusion_df.loc[
    [
        'MEF',
        'd2_intermediate',
        'd5_intermediate',
        'd2_induced',
        'd5_earlyiN',
        'Neuron',
        'Myocyte',

     ],
    [
        'embryonic fibroblast',
        'Early fibroblasts',
        'Midbrain dopaminergic',
        'Hindbrain serotoninergic',
        'cell of skeletal muscle',

     ]],
    cmap='viridis')
[8]:
<Axes: xlabel='projected_cell_type', ylabel='assignment'>
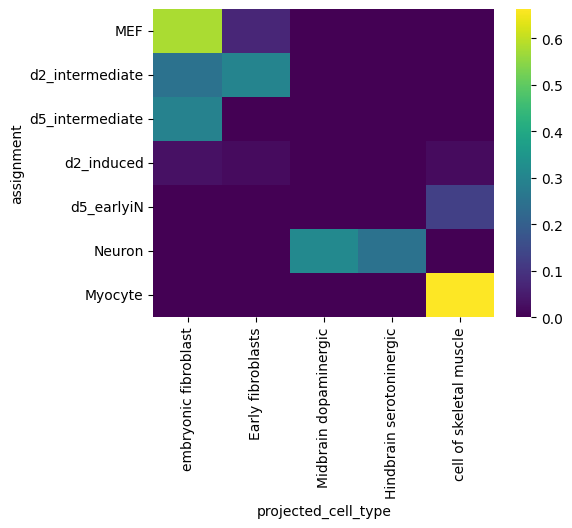
We can see that the transdifferentiated neurons and myocytes are projected to some physiological cell types of neurons and muscles.
What are the genes that agree or disagree with such projection? Let’s use myocytes as an example to compare the gene expression profiles of the query cell state and the projected cell state.
[9]:
# Normalize the reference dataset gene expression
sc.pp.normalize_total(adata_ref, target_sum=1e4)
sc.pp.log1p(adata_ref)
adata_ref.var['mean'] = np.array(adata_ref.X.mean(axis=0)).flatten()
X_csc = adata_ref.X.tocsc()
adata_ref.var['std'] = [np.std(X_csc.getcol(i).toarray()) for i in range(adata_ref.X.shape[1])]

# Get the cell types to compare
query_ct = 'Myocyte'
projected_ct = 'cell of skeletal muscle'
adata_selected_query = standardize_adata(adata[
    (adata.obs['assignment'] == query_ct) & (adata.obs['projected_cell_type'] == projected_ct)
].copy())

# Normalize the query dataset gene expression
sc.pp.normalize_total(adata_selected_query, target_sum=1e4)
sc.pp.log1p(adata_selected_query)

adata_selected_ref = adata_ref[
    adata_ref.obs['cell_type'] == projected_ct
].copy()

# Compare the mean gene expression in the query and reference cell types
x_query = adata_selected_query.X.mean(axis=0) - adata_selected_ref.var['mean']
x_query = x_query / np.maximum(adata_selected_ref.var['std'], 0.1)
x_ref = np.array(adata_selected_ref.X.mean(axis=0)).flatten() - adata_selected_ref.var['mean']
x_ref = x_ref / np.maximum(adata_selected_ref.var['std'], 0.1)

comp_df = pd.DataFrame({
    'gene': list(adata_selected_ref.var['human_gene_name']),
    'x_query': x_query,
    'x_ref': x_ref,
}).set_index('gene')

comp_df['x_diff'] = comp_df['x_query'] - comp_df['x_ref']

# Only keep the genes measured in the query dataset
comp_df = comp_df[comp_df.index.isin(
    gene_name_mapper.map_gene_names(adata.var.index, 'human', 'human', 'id', 'name'))].copy()

# Find the matched and unmatched genes
double_pos_genes = comp_df[(comp_df['x_query'] > 2) & (comp_df['x_ref'] > 2)
                           ].sort_values('x_ref', ascending=False)[:4].index.values

q_pos_r_neg_genes = comp_df[(comp_df['x_query'] > 3) & (comp_df['x_ref'] < 1)
                           ].sort_values('x_diff', ascending=False)[:4].index.values

q_neg_r_pos_genes = comp_df[(comp_df['x_query'] < 1) & (comp_df['x_ref'] > 3)
                            ].sort_values('x_diff', ascending=True)[:4].index.values

print('Double positive genes:')
display(double_pos_genes)
print('Query positive, ref negative genes:')
display(q_pos_r_neg_genes)
print('Query negative, ref positive genes:')
display(q_neg_r_pos_genes)

# Plot the gene expression comparison
fig, ax = plt.subplots(figsize=(4, 4), dpi=100)

ax.scatter(comp_df['x_query'], comp_df['x_ref'], s=1, rasterized=True)

comp_df_to_show = comp_df[comp_df.index.isin(
    np.concatenate([double_pos_genes, q_pos_r_neg_genes, q_neg_r_pos_genes]))]

for i, row in comp_df_to_show.iterrows():
    ax.text(row['x_query'], row['x_ref'], i, fontsize=8)

ax.axhline(c='grey', lw=0.5)
ax.axvline(c='grey', lw=0.5)
ax.set_xlabel(query_ct + ' normalized expression', fontsize=10)
ax.set_ylabel(projected_ct +  ' normalized expression', fontsize=10)

plt.show()
Double positive genes:
/home/xingjie/Softwares/SCMG/scmg/preprocessing/data_standardization.py:158: FutureWarning: X.dtype being converted to np.float32 from float64. In the next version of anndata (0.9) conversion will not be automatic. Pass dtype explicitly to avoid this warning. Pass `AnnData(X, dtype=X.dtype, ...)` to get the future behavour.
  adata_standard = anndata.AnnData(
array(['TNNC2', 'MYL11', 'MYL1', 'TNNT3'], dtype=object)
Query positive, ref negative genes:
array(['ASCL1', 'GPC1', 'KRT33A', 'PRUNE2'], dtype=object)
Query negative, ref positive genes:
array(['MYOZ1', 'ATP2A1', 'MYBPC2', 'ACTN3'], dtype=object)
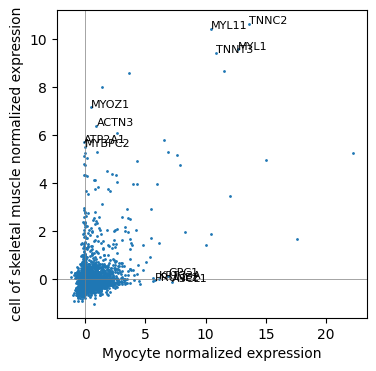
While the transdifferentiated muscle cells expressed MYL1 and TNNC2, they did not express genes such as MYOZ1, which might cause the induced muscle cells to function differently than the normal muscle cells.
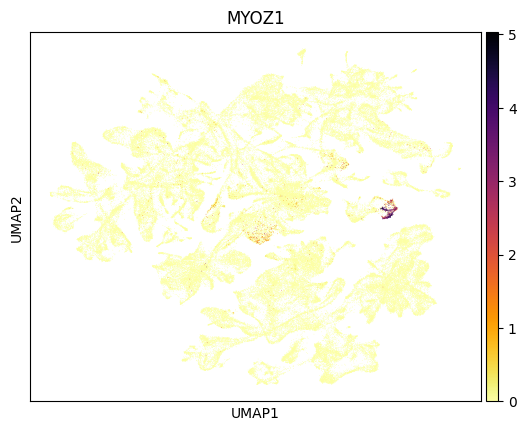
We can plot the global gene expression pattern of MYOZ1 to see that it is indeed a marker gene of skeletal muscle cells.
[10]:
adata_ref.var.index = adata_ref.var['human_gene_name']
sc.pl.umap(adata_ref, color=['MYOZ1'],
           cmap='inferno_r')
[ ]: